Data Analysis
Galigeo for Salesforce allows to create analytics like Pie Chart, Proportional Symbol or Choropleth based on a data.
To achieve this, a Galigeo Admin user need to define a data source and some analytics based on data sources.
In this article
- Manage Data Sources
 Step 1: Fill Data Source Properties
- Step 2: Define Data
- Clone a data source
- Manage Analytics
- Clone an analytic
Manage Data Sources
In the Galigeo Admin tab, click on “Analytics” to switch to the Data Sources Administration panel.
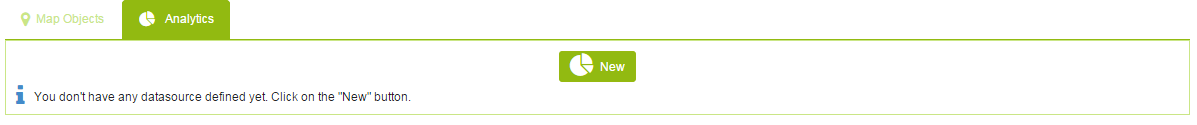
Click on the “New” button to go the Data Source creation page.
Step 1: Fill Data Source Properties
Choose a name for your data source, select the type of the data source.
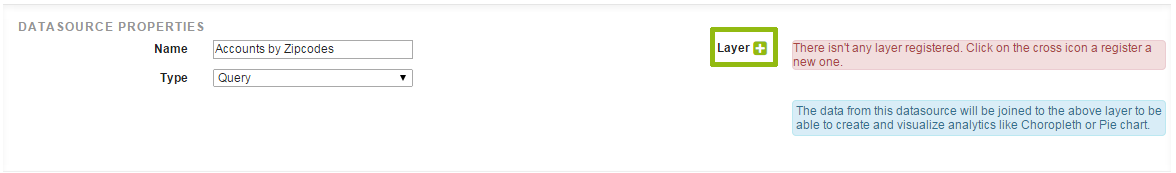
At the first time, there isn’t any geographic layer register as mentioned in red. Click on the  icon to register a new layer.
Let select the “Zipcodes (USA) – SAMPLE” and click the “Save” button. Now it is possible to choose a layer on which the result will be joined.

Step 2: Define Data
There are two ways to define what data will be exposed from this datasource:
- Simple mode: Choose fields from an object (Standard or Custom)
- Advanced mode: Write a Full SoQL query
For both modes, let’s define a datasource for which we want the sum of the annual revenue of accounts by Zip Code.
-
Simple Mode: In the objects dropdown list, select the Account Object.
The “Available Fields” will refresh with all the Account Object fields. Select “Billing Zip/Postal Code” and “Annual Revenue” fields and click Add button (right arrow icon). Then, choose to group the result with the “Billing Zip/Postal Code” field. Once you choose to group your data by a field, you need to define which aggregate function will be used for other fields. Let’s select the “SUM” function for the “Annual Revenue” field.

For each selected fields, the following icons allows different actions:
 : remove the field
 : move the field up
 : move the field down
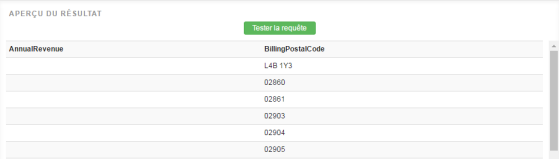
Then click the “Test” button to have preview of your data:
-
Full SOQL Mode: Select the “Full SOQL Query” checkbox to switch to the advanced mode. This mode allow the user to enter a SOQL query that will be used to get the data. The previous example can be defined in SOQL query as follow:
SELECT BillingPostalCode, SUM(AnnualRevenue) AnnualRevenue
FROM Account
GROUP BY BillingPostalCode
You can find more informations on how to define a Salesforce Object Query Language (SOQL) query.

Queries are subject to the Salesforce Governors Limits. The use of the Simple Mode is well for limited number of rows because there isn’t any where clause available to set the query selective. Otherwise, we recommend to use the Full SOQL Mode in order to filter as well your data. 
For both simple mode and Full SOQL mode, user needs to follow one rule: The first field needs to be able to match the geographic layer and type of String.
For example:
- For USA, you can use a Zip Code field of the Account Object (Billing or Shipping)
Once you are satisfied with what your Data Source has to expose, click the “Save” button to save it and user is forwarded to the Data Source details page:
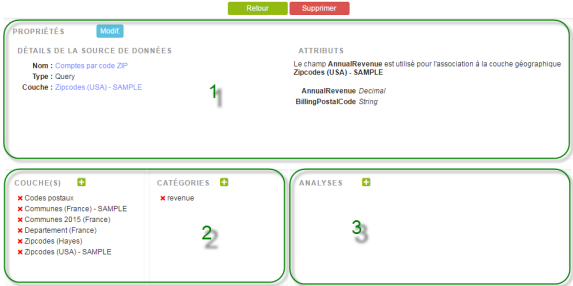
From this page, user can go back to the Galigeo Admin page or delete the data source.
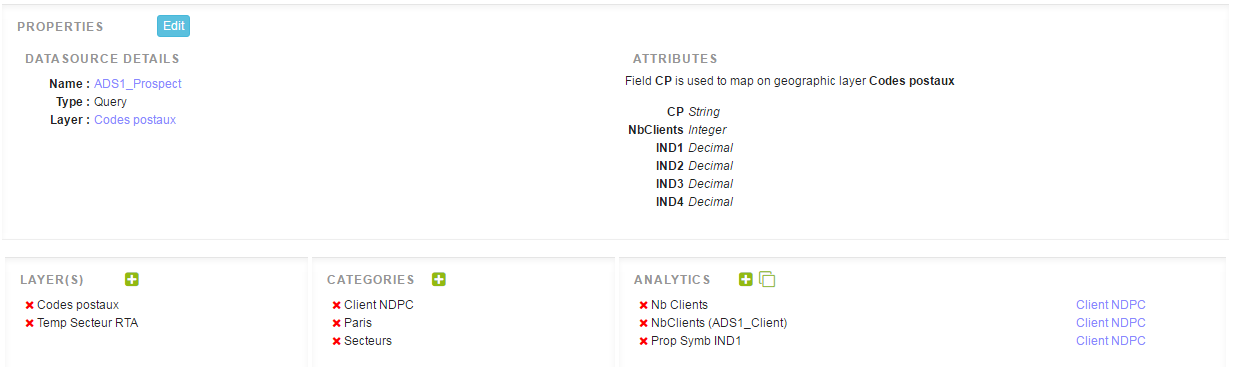
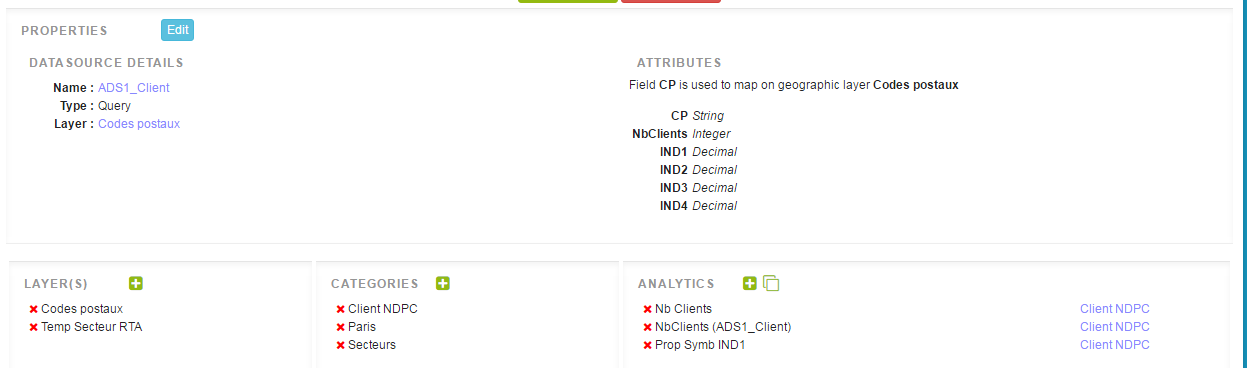
The Data Source details page has three main parts:
-
Properties: displays the data source properties like its name, type, which geographic layer is used and what metrics are exposed.
The name and the geographic layer properties can be edited inline. User has to double-click on it.
For the name: in edit mode, an input text is displayed, allowing to change the name:
The user can save or cancel his changes by clicking on the top button:
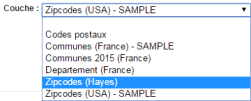
For the geographic layer: in edit mode, a select option list displays all registered geographic layers:
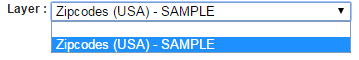
User can change the layer on which the data will be joined. If no layer is selected, user will not be able to create analytics based on the data source metrics.
-
This is common to all Data Sources:
a. Manage geographic layers:
 Add a geographic layer. Click on the icon to display a popup where all available layers are listed. Select one and click on the “Save” button to register it:
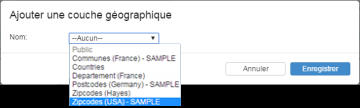
The layer panel lists several layers:
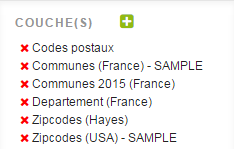
It’s now possible to change the layer used to join the datasource data:
 : delete a layer
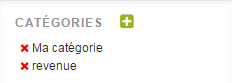
b. Manage categories
A category can be assigned to an analytics to group them. It allow the end user to have a list of all available analytics created by the admin user grouped by category when he’s creating his map.
 Add a category. Click on the icon to display a popup. Enter a name for the category and click on the “Save”.
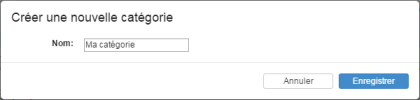
The category panel lists the new category:
For an analytic, if no category is defined, double click on the message “Double click to set a category”.
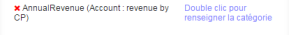
Select a category from the list,
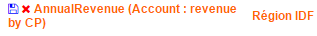
Click on the floppy disk icon to save the analytic.
: delete a category -
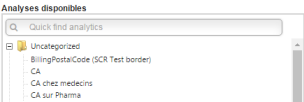
Analytics: this panel shows all analytics created on the data source’s metrics.
a. Available actions
Add an analytics. Click on the icon to display the analytic wizard application. Duplicate an existing analytic.
 Edit an analytic delete an analytic
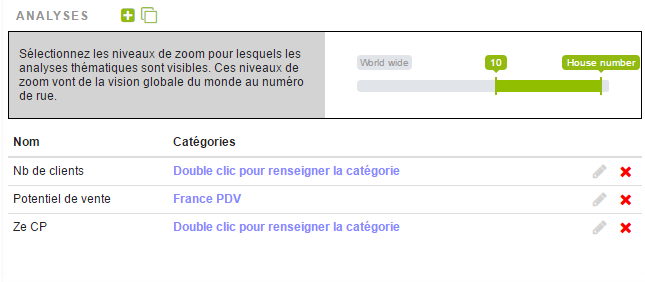
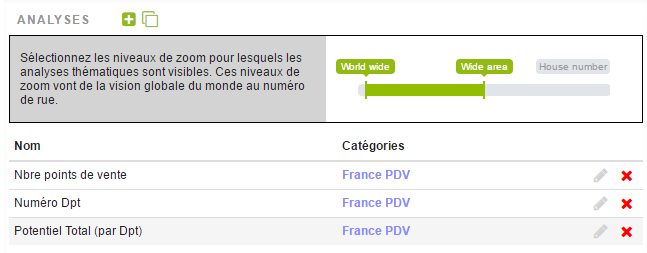
b. Visibility thresholds
Visibility thresholds allow to set the zoom levels at which you wish to activate your analytics. They work on a data source.
Zoom levels go from world wide view to house number view.
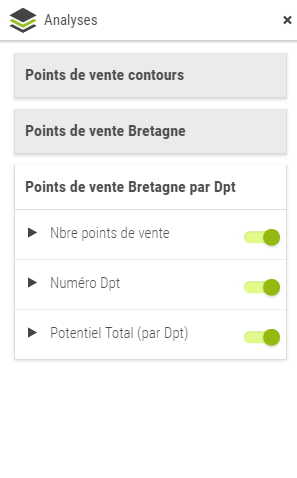
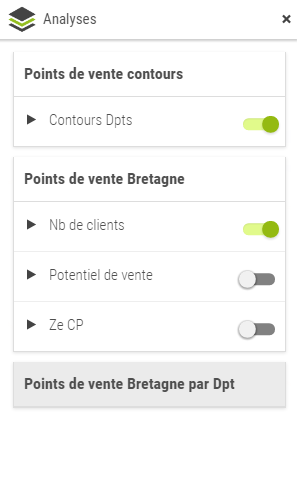
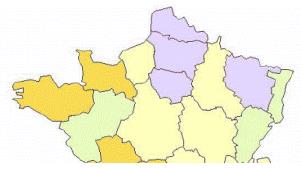
In the example below, we created analtytics displaying information at the level of a french departement. They are displayed for the upper zoom levels. For more detailed zoom levels, analytics display the same information at a zipcode level.
In the analytics panel, please note that hidden analytics are grayed.
Departement analytics zipcode analytics 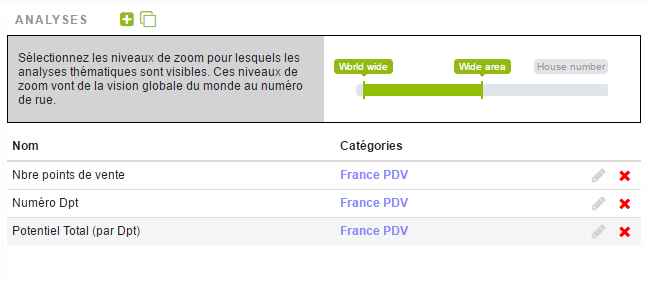
Clone a data source
Let’s assume that a data source has been defined on the Accounts which Record Type is “Client”. It uses the whereclause below:
WHERE RecordType.Name = 'Client'

We now want to produce the same analytics on Accounts with “Prospect” Record Type. Let’s clone our data source and the corresponding analytics.
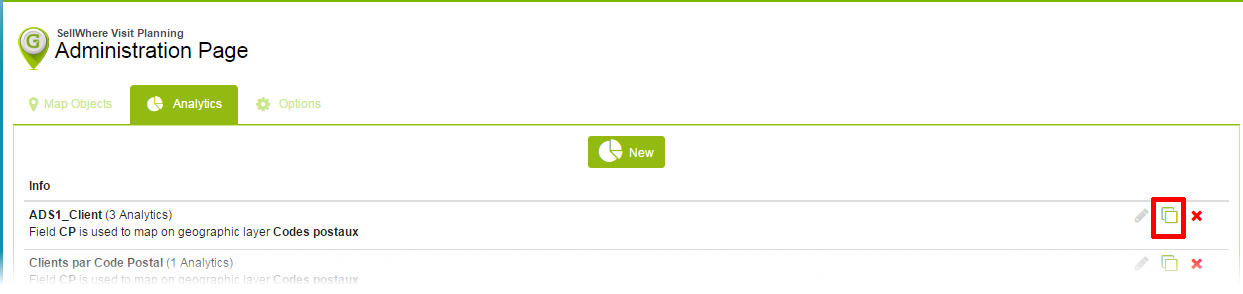
In the “Analytics” tab of the administration panel, click the icon, give your new data source a name and save it.
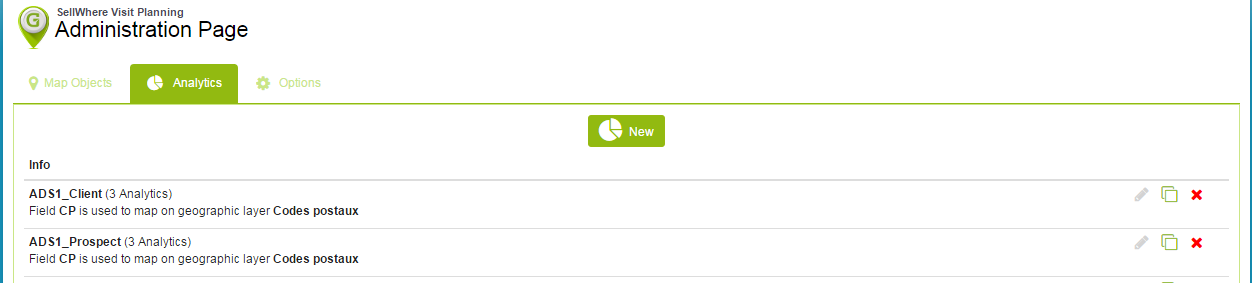
On the newly created data source “ADS1_Prospect”, all “ADS1_Client” properties have been cloned.
Click the Edit button and change the whereclause so that it adresses only Accounts with “Prospect” Record Type:
WHERE RecordType.Name = 'Prospect'
Manage Analytics
Since we have our “Accounts by Zipcode” data source linked on the USA Zip Codes, it’s time to create analytics.
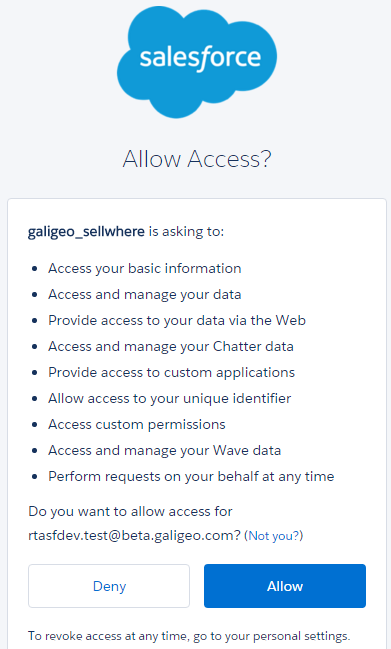
Click on the icon in the Analytics panel to run the Analytic Wizard.
The Thematic Wizard is a connected application hosted on Heroku. The first you run it, you will be asked to allow this application to connect to your Salesforce data and access to the Analytic Wizard Application:
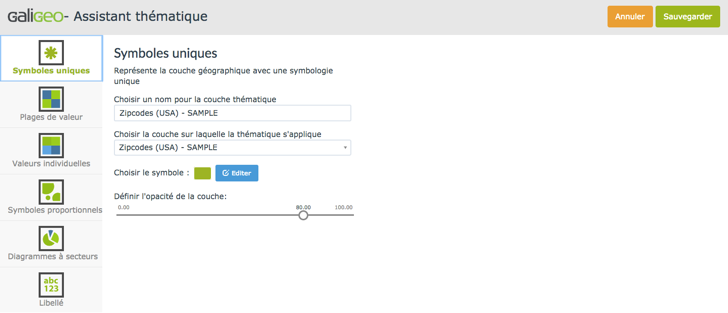
Here you can defined the type of analytic you want to create:
-
Uniq symbols
This type of analysis allows to display the borders of a geographical layers or to display a symbol in its center.
-
Range color:
This type of analysis enables the repartition of numerical data in several range values. To each range values is associated a unique color.
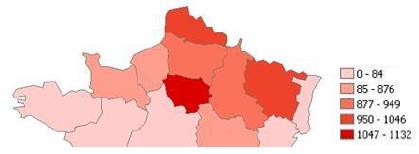
The creation window for this representation is displayed as follows:
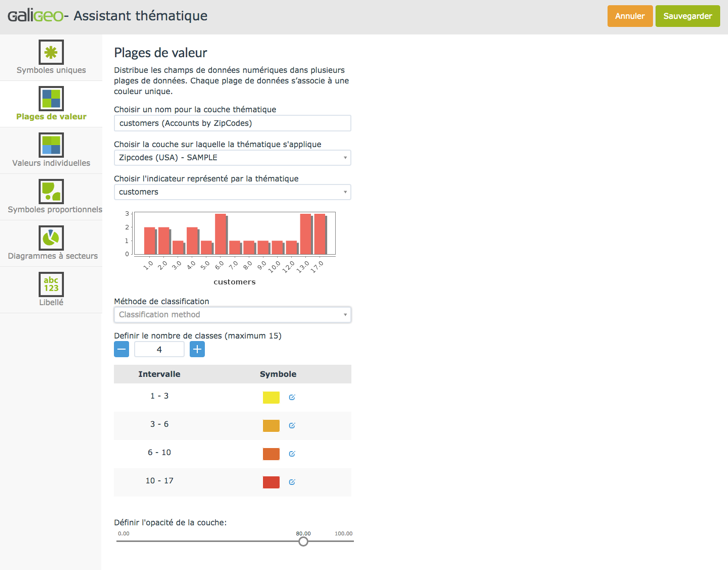
The Field control one can select the field for the analysis.
The Method will help choose the type of calculation for the analysis. There are three calculation methods available:
- Quantiles: This method divides automatically the values in a manner that each range has an identical number. The boundaries are automatically calculated (and recalculated at every query refresh).
- Equal Interval: This method divides automatically the values in intervals of the same size. The difference between the upper boundary and lower boundary is the same for each interval. Similarly, the boundaries are automatically calculated (and recalculated at every query refresh).
- Jenks (Natural Breaks method): This method divides automatically the value in homogeneous intervals defined by the reading of the bar chart of frequencies of the series. The boundaries are automatically calculated and correspond to significant breaks of the number.
- Manual: This method allows you to manually set the thresholds which set classes apart. Example: Setting apart negative and positive values.
From the Classes one can set the number of classes for the thematic (by default it is set to 4).
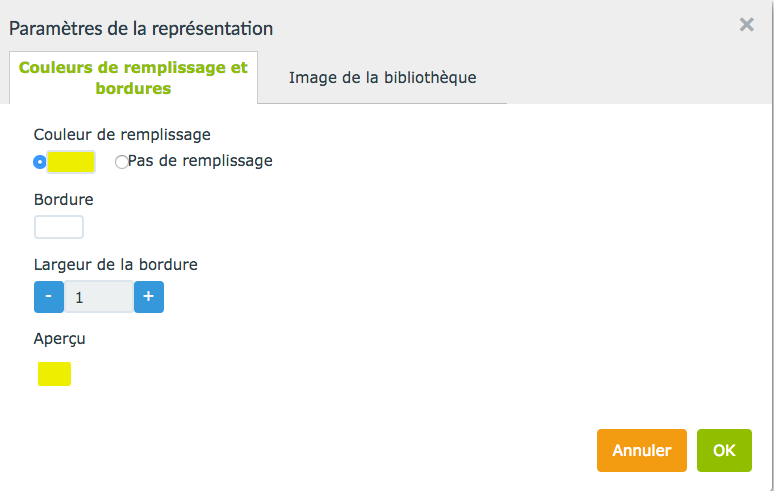
Inside the table control one can set the color, the type of symbol to be used, and the size of the symbol:
-
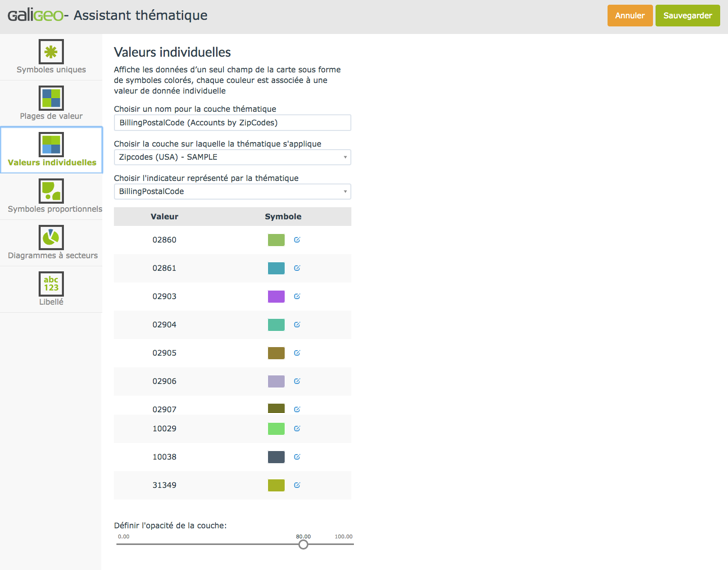
Individual color:
This type of representation allows displaying of data that have a single value through colored symbols.
This type of representation is applied only to fields of alphanumeric values (strings), however it is also usable on numeric fields.
The configuration of the functionality is similar as for the Range Color with the controls having same type of roles.
-
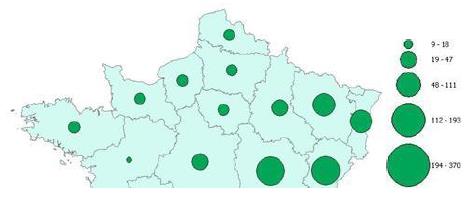
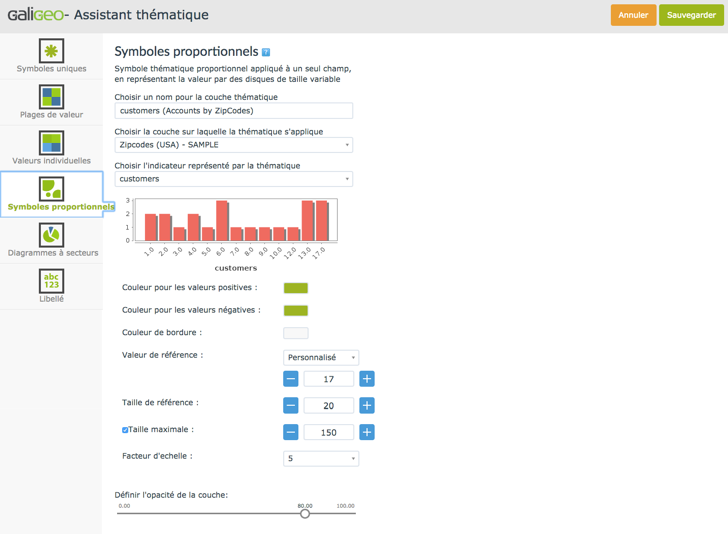
Proportional Symbol:
This analysis type allows dividing the numeric data in function of their values, in a proportional manner.
-
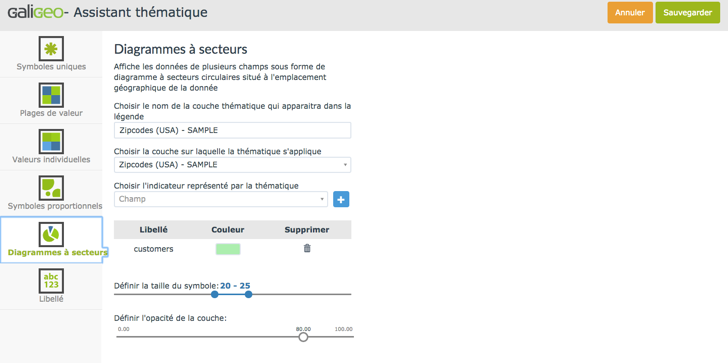
Pie charts
This representation type allows displaying several query indicators, or several queries using pie charts.
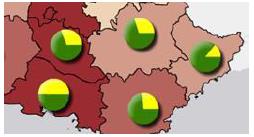
This representation type is applied specifically to numeric values fields.
-
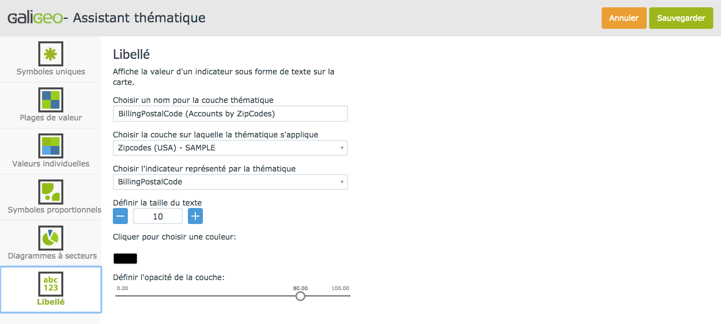
Label Thematic
Display, as text, the value of an indicator or a geographical label on the map.
When the configuration of the analysis is done, save it by clicking on the “Save” button. Clicking on the “Cancel” button will cancel all the settings.
After creating analysis, on the Data Source Administration panel, user can see for each datasource, analysis created on it.
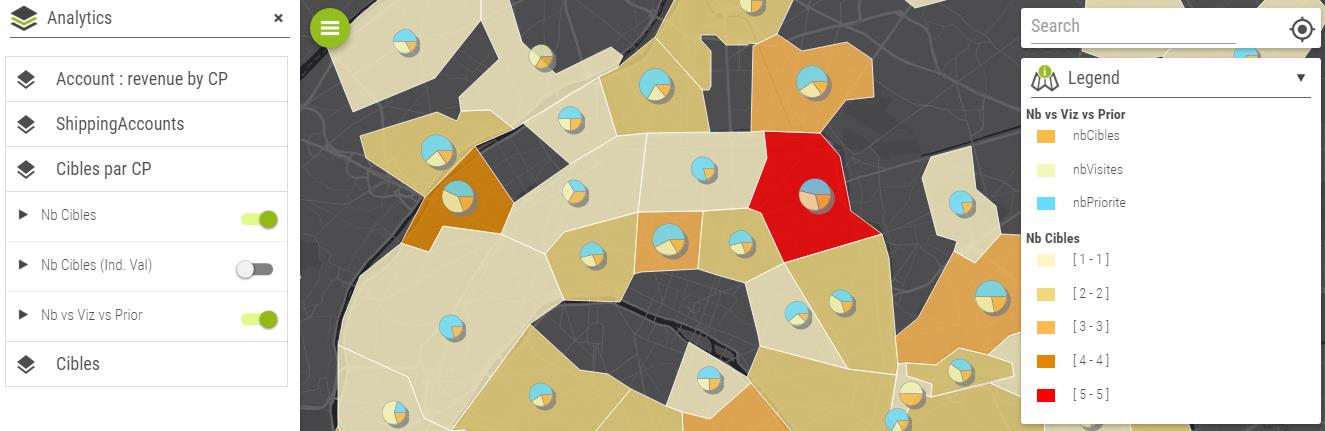
When an end user defined its visual dataset and add some analytics to it, the map interface shows controls to switch on/off analytics and their legend as shown below.
Clone an analytic
Let’s assume that a data source has been set up on the Accounts with the record Type est “Client” and with zipcodes starting with 59 or 62. Some analytics also have been set up on this object.
WHERE Postal_Code__c Like '59%' or Postal_Code__c Like '62%'
We wish to replicate these analytics for Clients whose zipcodes start with 78 or 75. In the data source, let’s change the whereclause:
WHERE Postal_Code__c Like '78%' or Postal_Code__c Like '75%'
Once this has been done, new analytics are ready to be used on the maps.