Analytics
If the user added some analytics to its document, the “Analytics”  icon and the “legend”
  icon will be available. A click on will open the Analytics panel:
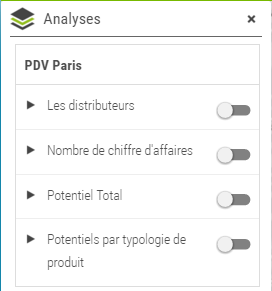
This panel will show all available analytics for the current map grouped by the source they are built on.
For each analytic, a toggle button allows to display the analytics on the map and legends are displayed in the panel at the top right of the page:
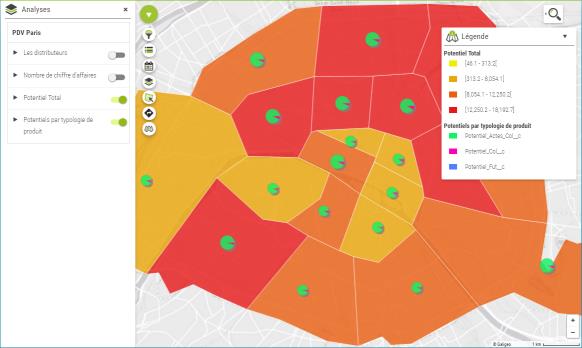
The icon in the toolbar allows to show/hide the legend panel at any time.
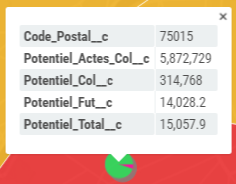
A click on any graphic from an analytic will display an information in which all indicators from the Salesforce query are showed and those used by the analytics are underlined:
 |
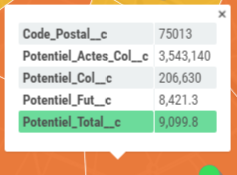 |
| Pie chart information window | Choropleth information window |